HR Analytics Reporting
HR analytics reporting refers to the systematic collection, analysis, and interpretation of workforce-related data to inform decision-making and optimize HR functions. As organizations strive for competitive advantage through strategic human capital management, robust HR analytics have become essential. Evidence links the adoption of HR analytics to improved organizational performance, yet full strategic integration remains low in many companies (Marler & Boudreau, 2017).
Monthly vs. Annual HR Analytics Reports
Monthly reports are tactical, focusing on real-time trends like turnover, recruitment efficiency, and training outcomes. They support rapid intervention and adaptation (Marr, 2018). Annual reports, on the other hand, provide a strategic overview, aggregating broader KPIs such as workforce demographics, pay equity, and alignment with long-term business goals (Fink & Sturman, 2017).
Types of Data and Key Performance Indicators (KPIs)
Data sources range from basic headcount, absenteeism, and turnover statistics to more nuanced data such as engagement scores, internal mobility, and competency mapping (Bassi et al., 2015). KPIs are most valuable when directly linked to organizational objectives—for example, using turnover data to inform retention strategies or analyzing compensation equity to mitigate legal and reputational risks (Fitz-Enz, 2010).
Common Monthly HR Analytics Reports
- Turnover Analysis: Tracks monthly attrition. High or increasing turnover may signal issues in culture or management.
- Recruitment Efficiency: Measures time-to-fill and quality-of-hire, helping optimize recruitment pipelines (Mondore et al., 2011).
- Workforce Demographics: Assesses diversity, age distribution, and other attributes to support inclusion goals.
- Engagement Scores: Monthly surveys or pulse checks gauge employee sentiment and predict potential retention risks (Marr, 2018).
Essential Annual HR Analytics Reports
- Performance Reviews: Aggregated data reveals high and low performers, supporting talent development.
- Compensation Analyses: Benchmarks pay against industry standards and checks for internal equity (Fitz-Enz, 2010).
- Diversity Reports: Evaluates progress on inclusion and detects gaps in representation (Bassi et al., 2015).
- Example: Monthly turnover trend and annual diversity breakdown (adapted from Mondore et al., 2011).
Utilizing HRIS Systems for Analytics
Modern HR analytics rely heavily on Human Resource Information Systems (HRIS) for automating data collection, minimizing error, and enabling real-time reporting. HRIS platforms facilitate integration across payroll, recruitment, and performance management, allowing for more accurate and timely analytics (Marler & Boudreau, 2017).
Comparing Tools: HRIS vs. Excel
Excel remains a go-to tool for ad hoc reporting and small-scale analysis, valued for its flexibility and ease of use. However, as organizations scale, HRIS platforms become increasingly essential for managing complexity and large volumes of data. They offer automated data collection, advanced reporting, and integration with other business systems—features that Excel cannot match at scale (Mohammed, 2019).
Data Visualization in HR Analytics
Effective analytics require more than just numbers—they demand clear, compelling visuals. Data visualization tools like dashboards, charts, and graphs transform raw data into actionable insights, making trends and outliers instantly recognizable (Caughlin & Bauer, 2019; Upadhye, 2023).
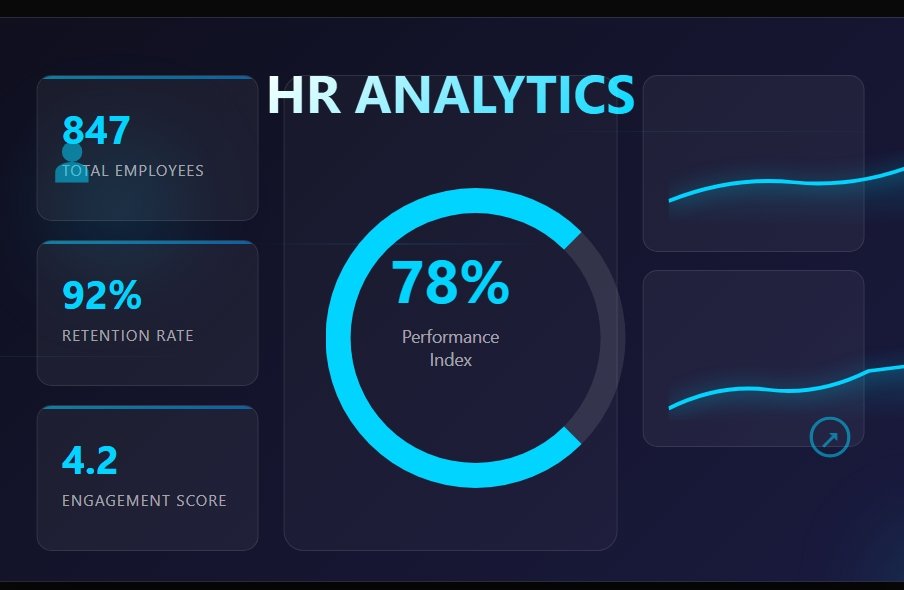
Sample Visualization:
Sample HR dashboard showing turnover, diversity, and engagement metrics (Upadhye, 2023).
Creating User-Friendly Reports
For non-HR audiences, best practices include:
- Executive summaries for key takeaways.
- Strategic use of visuals (pie charts for demographics; bar graphs for turnover).
- Eliminating jargon and providing definitions for key terms.
- Annotating complex metrics (Smith, 2013).
Collaboration with Finance and Accounting
Sound HR analytics depends on close collaboration with finance/accounting to ensure data accuracy and strategic alignment. This partnership supports budgeting, labor cost analysis, and ROI calculations for HR initiatives (Bassi et al., 2015).
Finance and Accounting Analytics Requirements
- Labor Cost Analysis: Breaks down total workforce costs, highlighting opportunities for efficiency.
- Budgeting for HR Initiatives: Guides resource allocation for maximum impact.
- ROI for Training: Quantifies the value of employee development to justify future investment.
Next Steps
HR analytics is a cornerstone of modern, data-driven HR strategy. By establishing clear KPIs, leveraging appropriate technology, and collaborating across functions, HR can drive meaningful, measurable improvements in workforce and organizational performance (Marler & Boudreau, 2017). Continued investment in analytics tools and skills, and a commitment to a data-informed culture, will position HR as a true strategic partner in business success.
References
- Marler, J.H., & Boudreau, J.W. (2017). An evidence-based review of HR Analytics.
- Fitz-Enz, J. (2010). The new HR analytics.
- Fink, A.A., & Sturman, M.C. (2017). HR metrics and talent analytics.
- Bassi, L., Creelman, D., & Lambert, A. (2015). Advancing the HR profession: consistent standards in reporting sustainable human capital outcomes.
- Marr, B. (2018). Data-driven HR: How to use analytics and metrics to drive performance.
- Mondore, S., Douthitt, S., & Carson, M. (2011). Maximizing the impact and effectiveness of HR analytics to drive business outcomes.
- Mohammed, D.A.Q. (2019). HR analytics: a modern tool in HR for predictive decision making.
- Caughlin, D.E., & Bauer, T.N. (2019). Data visualizations and human resource management: The state of science and practice.
- Upadhye, A. (2023). ILLUMINATING HR INSIGHTS: UNRAVELING PATTERNS THROUGH DATA ANALYTICS AND VISUALIZATION.
- Smith, T. (2013). HR analytics: The what, why and how.

